info@puhastusekspert.ee +372 5611 1048
What makes a client decide that a toilet is dirty?
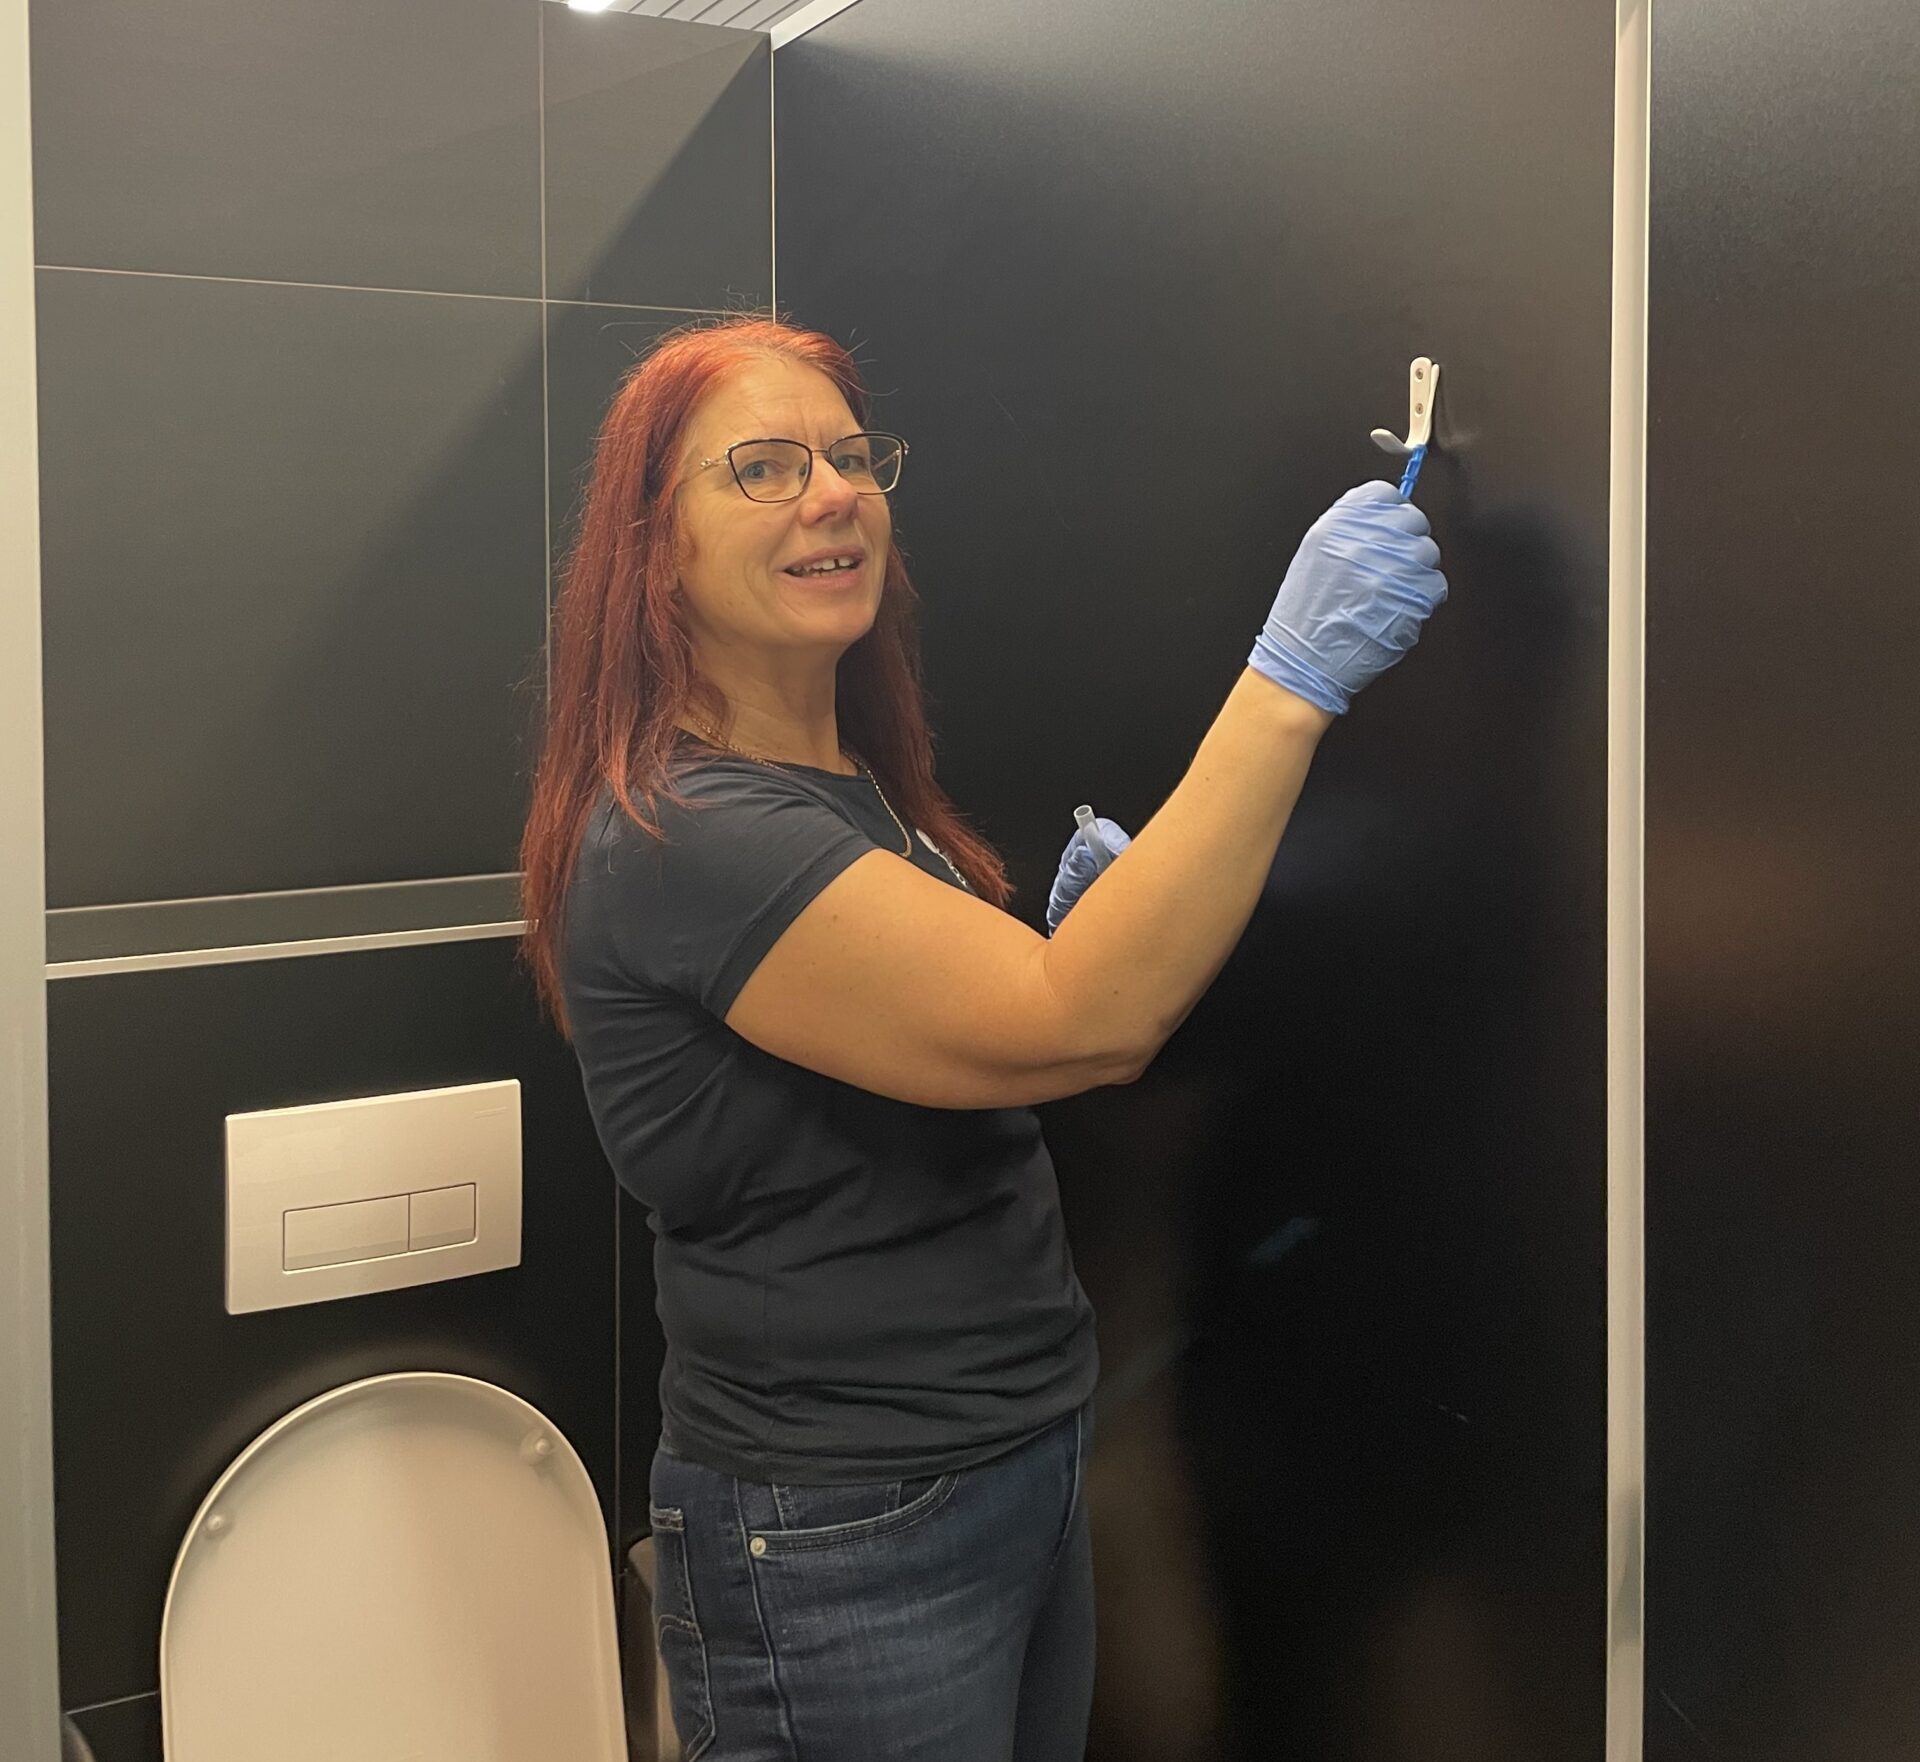
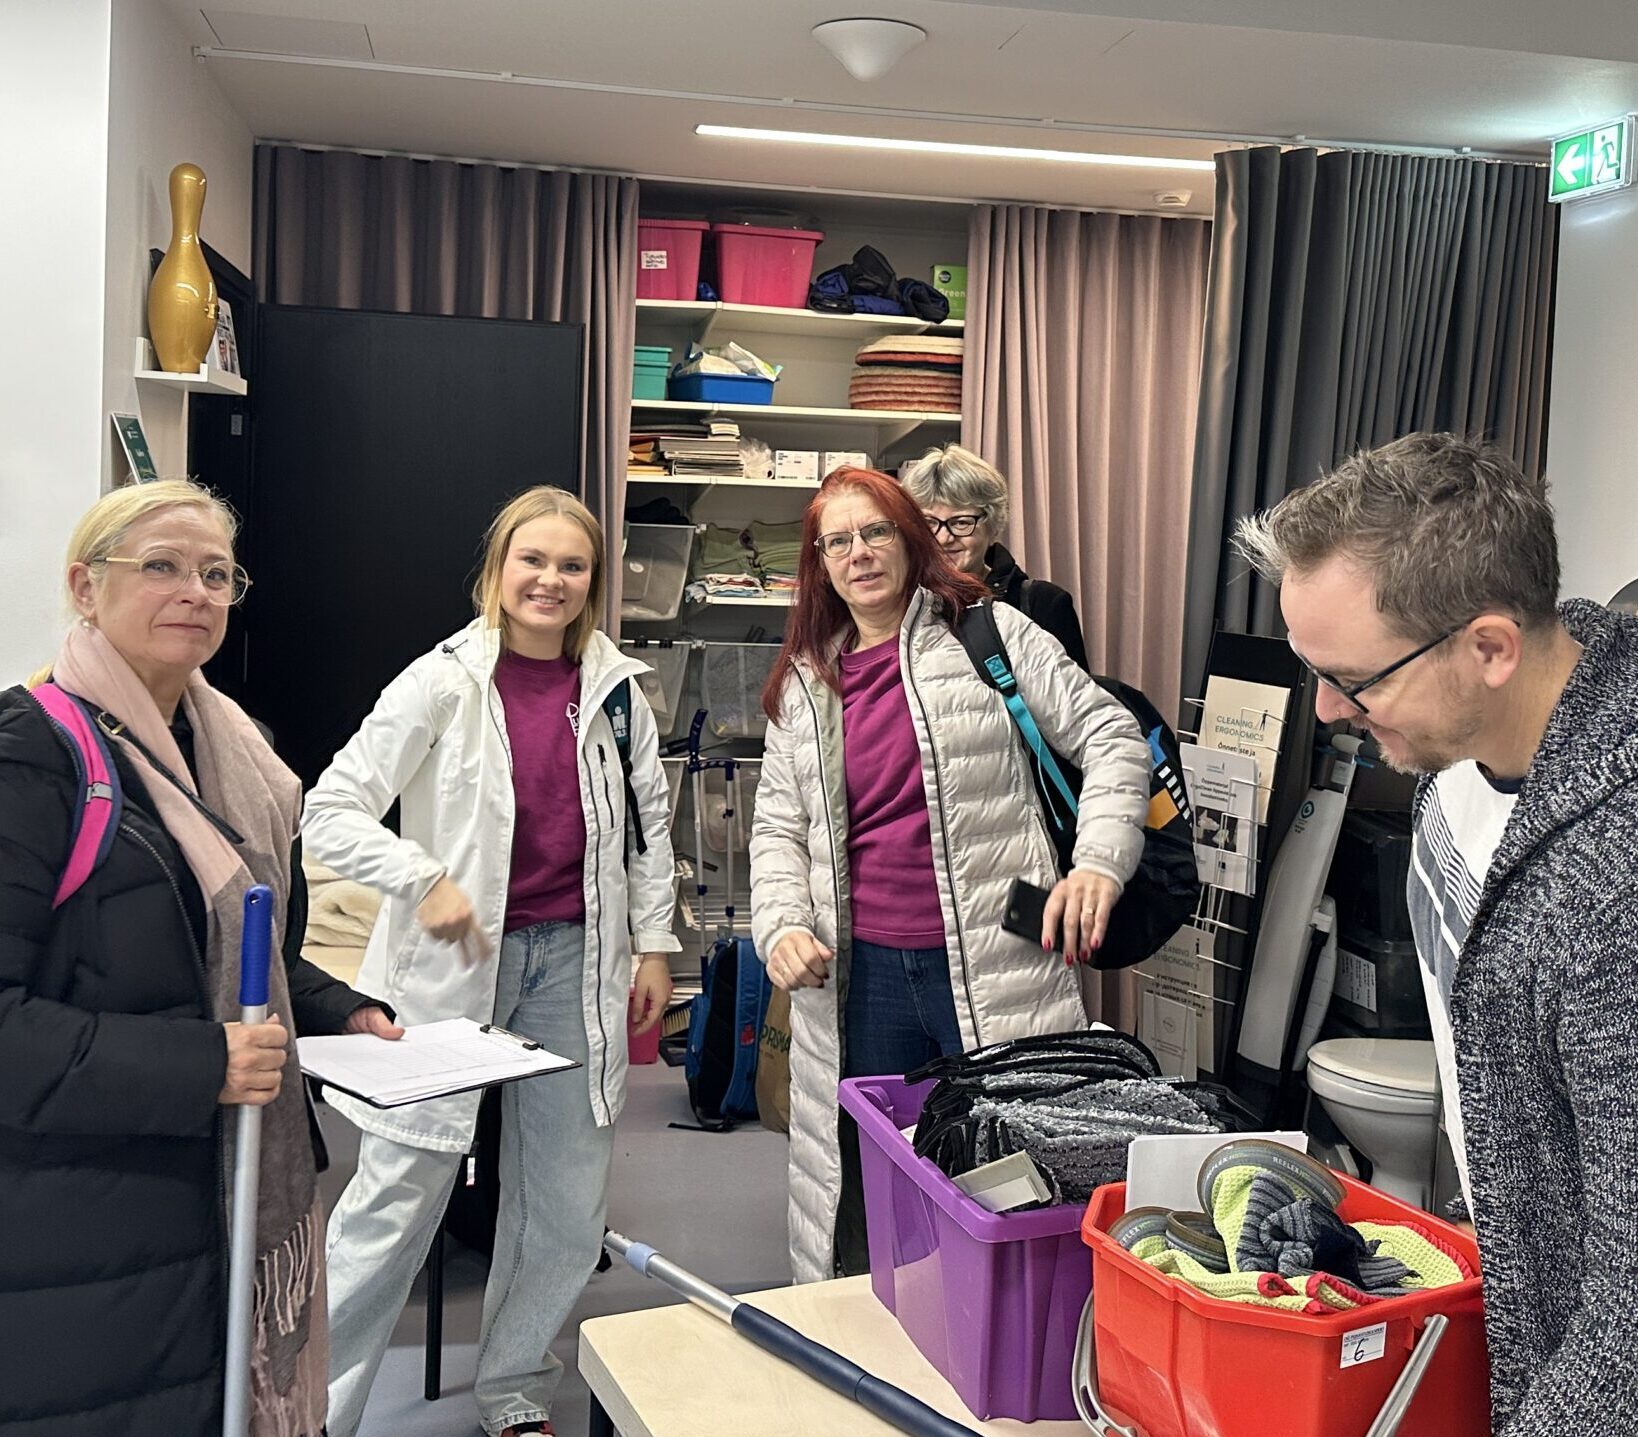
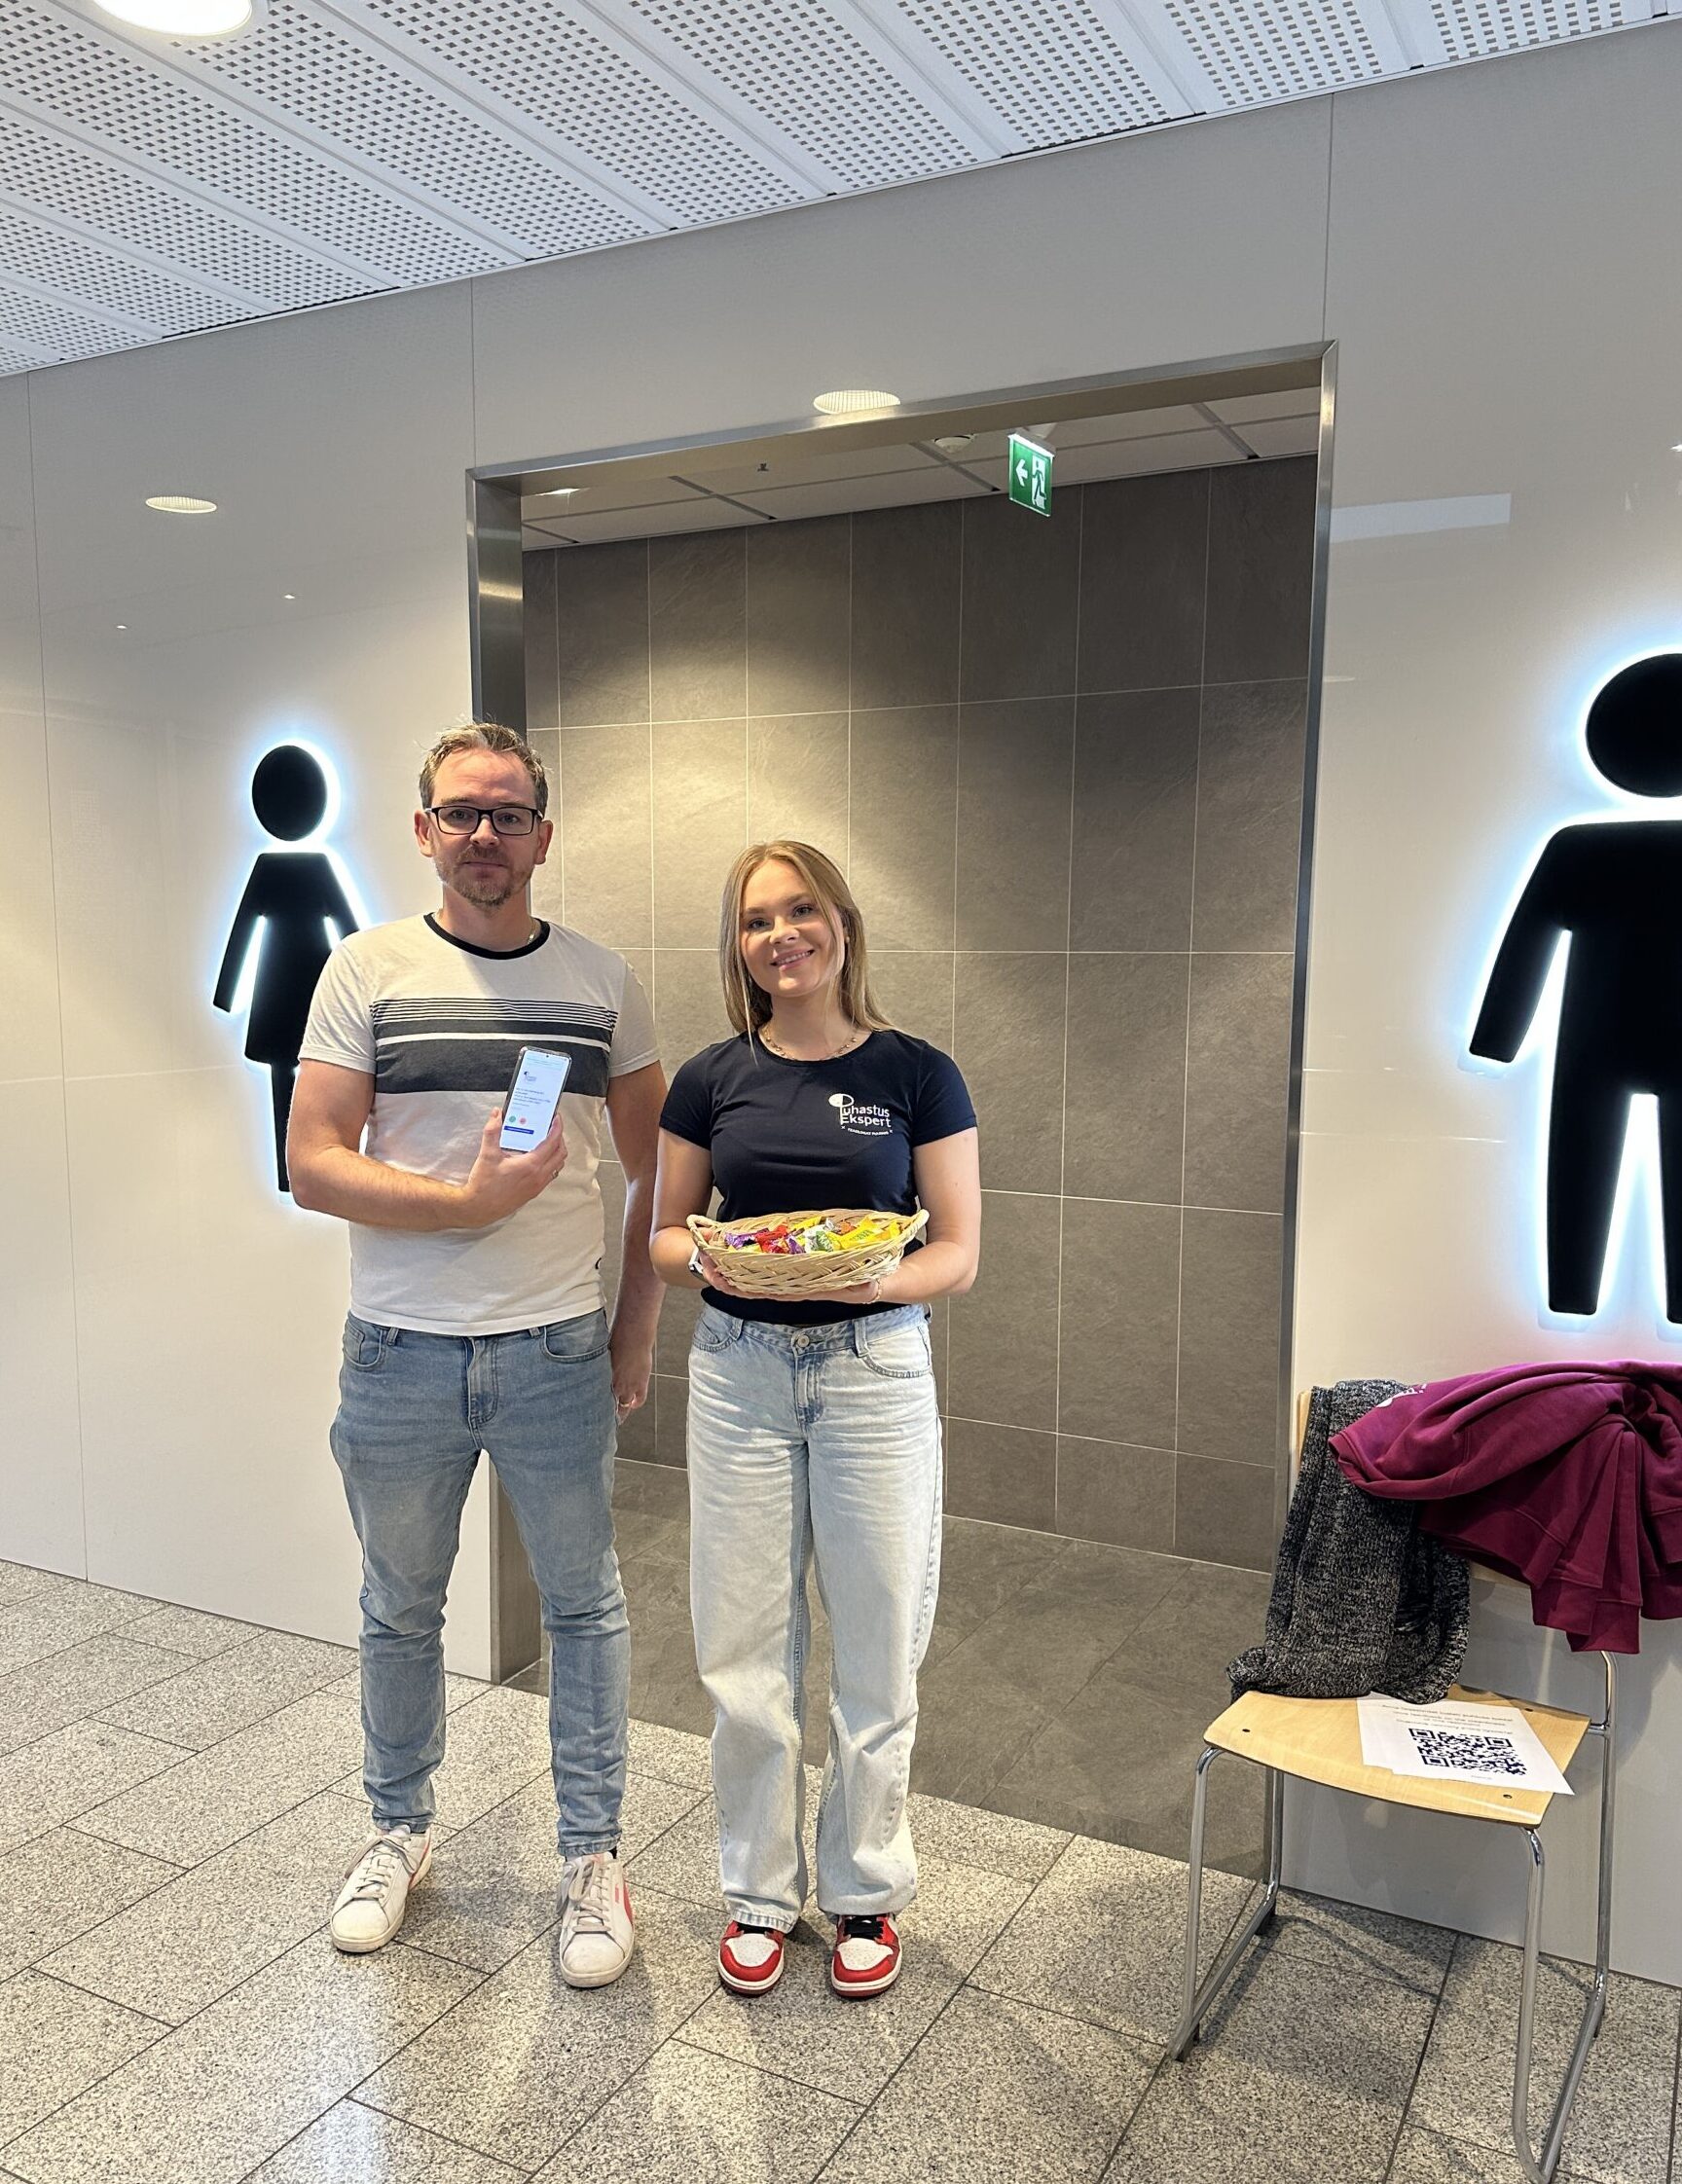
In early November, CleanMind Erasmus+ project partners met in Tallinn to conduct cleaning tests in public toilets. One of the project’s goals is to understand what makes people claim that a space needs cleaning, and we translate people’s opinions into INSTA800 quality standard numbers. Based on this information, it is possible to make changes in the cleaning process to utilize resources more efficiently based on need. To obtain initial information, we conducted pilot tests with project partners in Tallinn, with the ultimate goal of creating learning materials focused on implementing effective cleaning methods.
Does cleaning frequency always match the need?
Cleaning generally follows a fixed schedule, as contracts usually specify how often cleaning must be performed. Cleaning frequency does not always align with the actual cleaning need.
Our goal was to test:
During the tests, we collected client feedback and regularly conducted quality assessments. Additionally, we used ATP measurements to investigate the amount of dirt, its presence, and the effectiveness of cleaning.
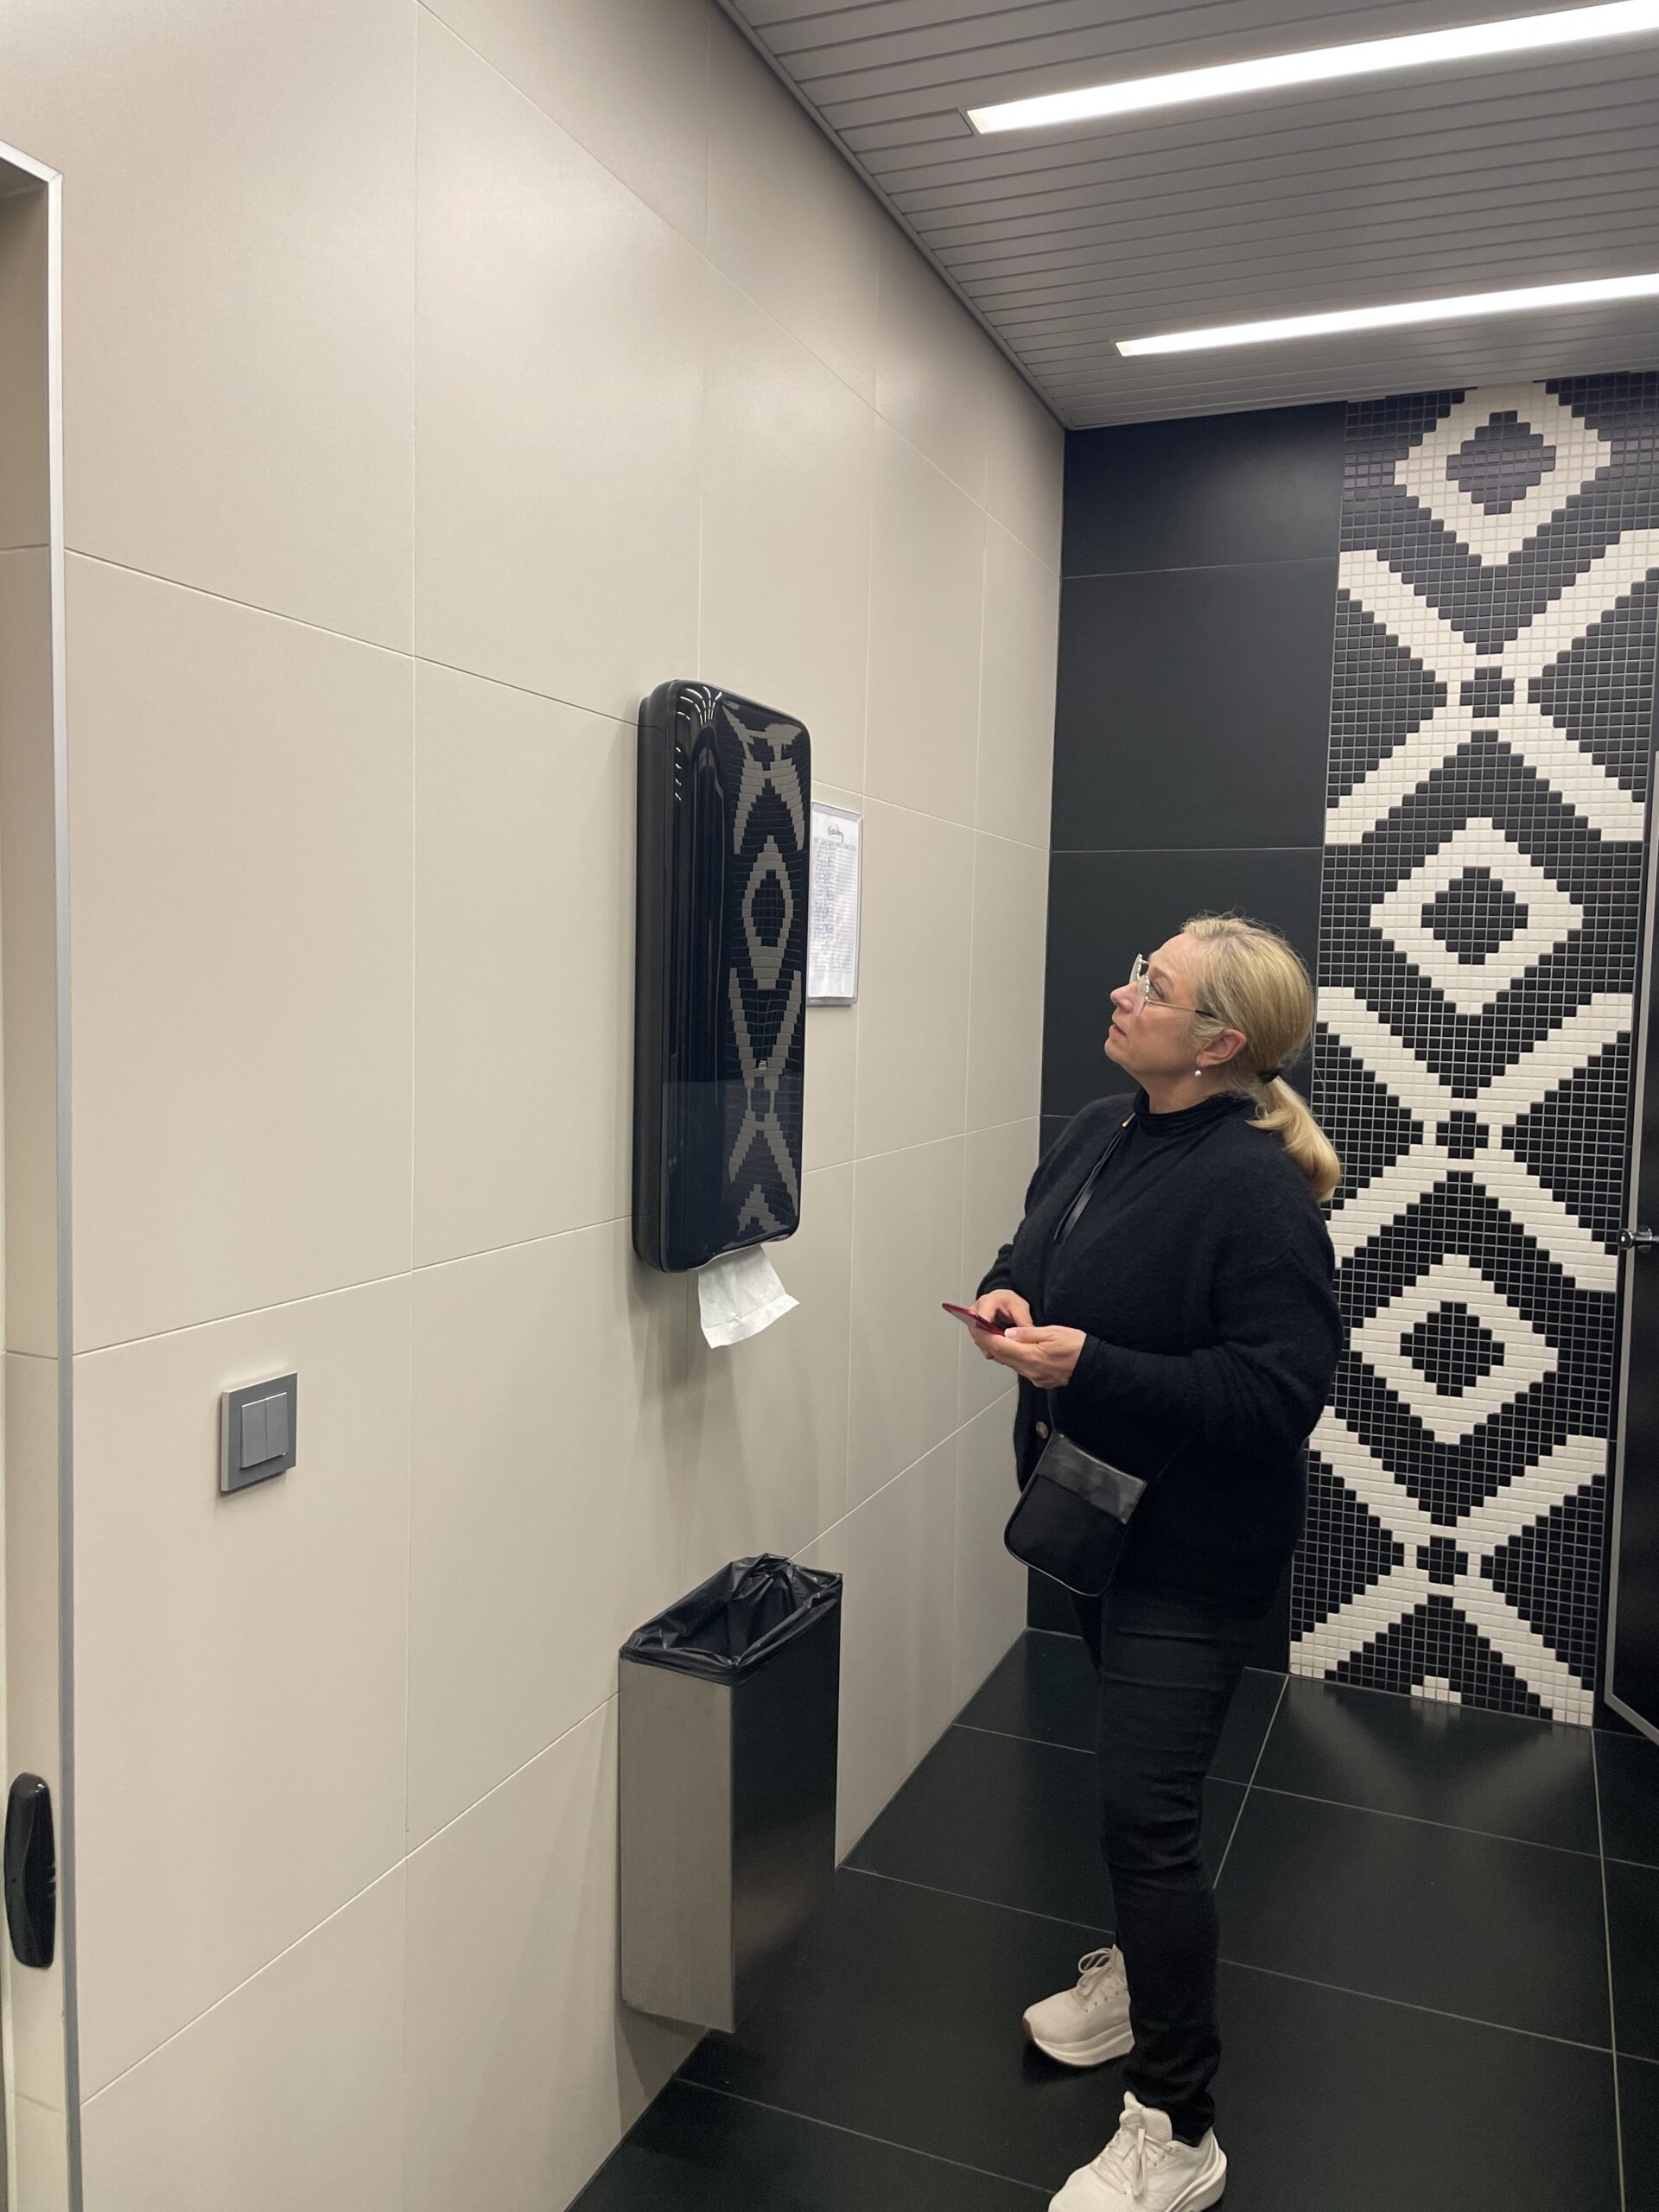
User feedback: when does the feeling arise that the toilet needs cleaning?
At the beginning of the test, we ensured that the toilet being tested met at least INSTA quality level 4, meaning the space was visually clean at the start of the experiment. Cleaning tests in public restrooms showed that people’s perception of cleanliness remained surprisingly positive for a long time. A negative feeling only arises when very specific and clearly perceptible problems emerge.
Most frequently, users indicated that the toilet needed cleaning when there was:
A significant discovery was that natural soiling did not provoke a negative reaction in people as quickly as we had anticipated. Furthermore, we found that some clients actively keep the toilet clean themselves, for example, by picking up paper scraps and putting them in the bin. Consequently, negative feedback did not accumulate as early as we and our project partners had expected.
Translating people’s opinions into the INSTA standard language
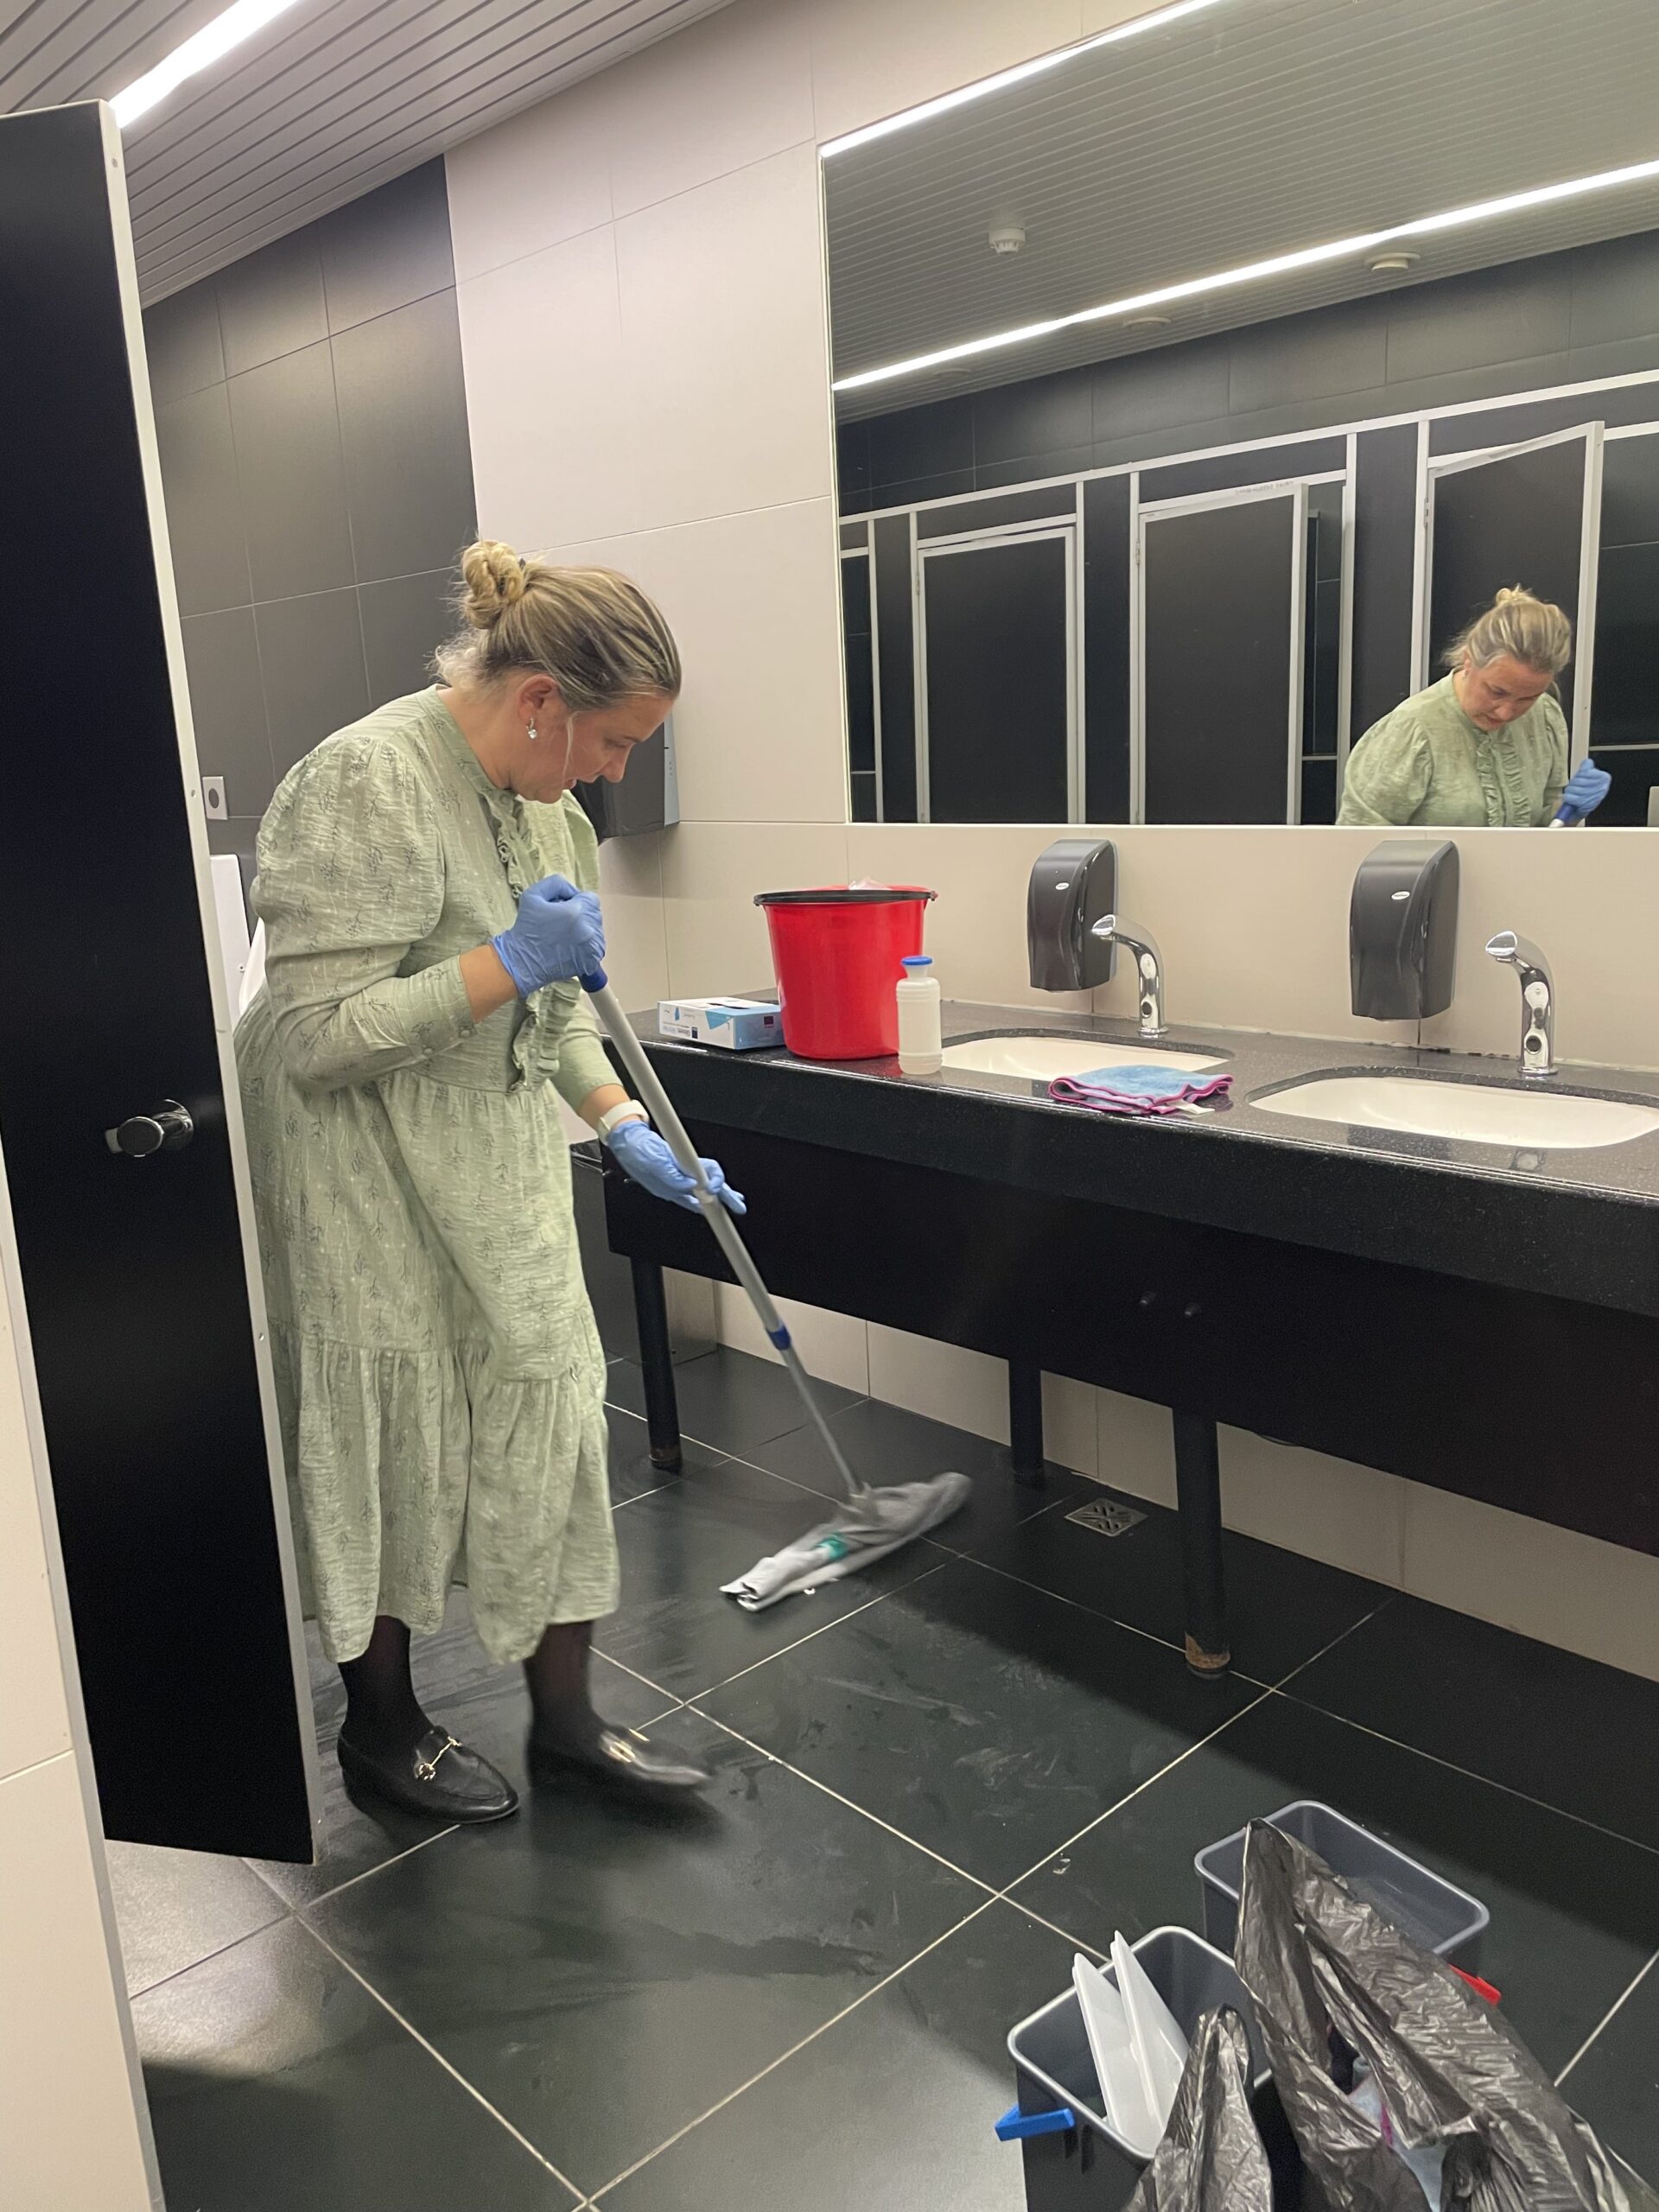
The cleaning tests at both test sites lasted 4 hours, during which we collected user feedback. To translate the users’ assessments of the spaces into numerical data, we also conducted regular quality assessments using the INSTA800 standard. We used the Optiqo application for both collecting feedback and visitor numbers, as well as for conducting quality assessments.
We conducted quality assessments every 30 minutes. The results of these regular assessments showed that:
This raised an important question: if, according to the INSTA assessment, a space needs cleaning, but the user does not notice it – which should we prioritize?
During the tests, it became clear that the primary type of dirt was loose debris, which accumulated specifically on floor surfaces. In the men’s toilet, this was also the main reason why the space no longer met quality requirements. In the women’s toilet, a different problem stood out. Inside the toilet stalls, significantly more toilet paper dust accumulated than in the men’s toilet. However, during the test, not many new stains appeared in either toilet. This information is very valuable for designing future tests.
ATP tests
Measurements with ATP tests provided an important lesson: a visually clean surface may not actually be clean.
Key discoveries thanks to ATP tests:
Key discoveries thanks to ATP tests:
This knowledge is necessary to understand which surfaces are actually dirty and how to remove dirt with minimal resources.
Important lessons for future tests
The pilot test provided valuable practical knowledge regarding both data collection and understanding clients. Thanks to these initial tests, we can collect more precise and comparable information in future tests:
The initial tests also provided us with a clear overview of how users react to different types of dirt, what data is actually worth collecting, and how to conduct future experiments more efficiently. Furthermore, the tests confirmed that a toilet cleaned to INSTA quality level 4 remains clean for an incredibly long time.
Most importantly, the pilot tests demonstrated the potential for results-based and needs-based cleaning. Thanks to this, we can focus on more precise measurements in future tests.
Author: Maria Liis Alt